- Titel: Objects in Space
- Veröffentlichungsdatum:
- Entwickler:
- Herausgeber:
Information about Objects in Space is still incomplete. Bitte helfen Sie uns dabei, die Details des Spiels auszufüllen Kontaktformular.
Deciphering the „trading_xxx.txt“ files for fun and profit. Please comment if you have any ideas about what the file contents mean!
Die Tabellenkalkulation
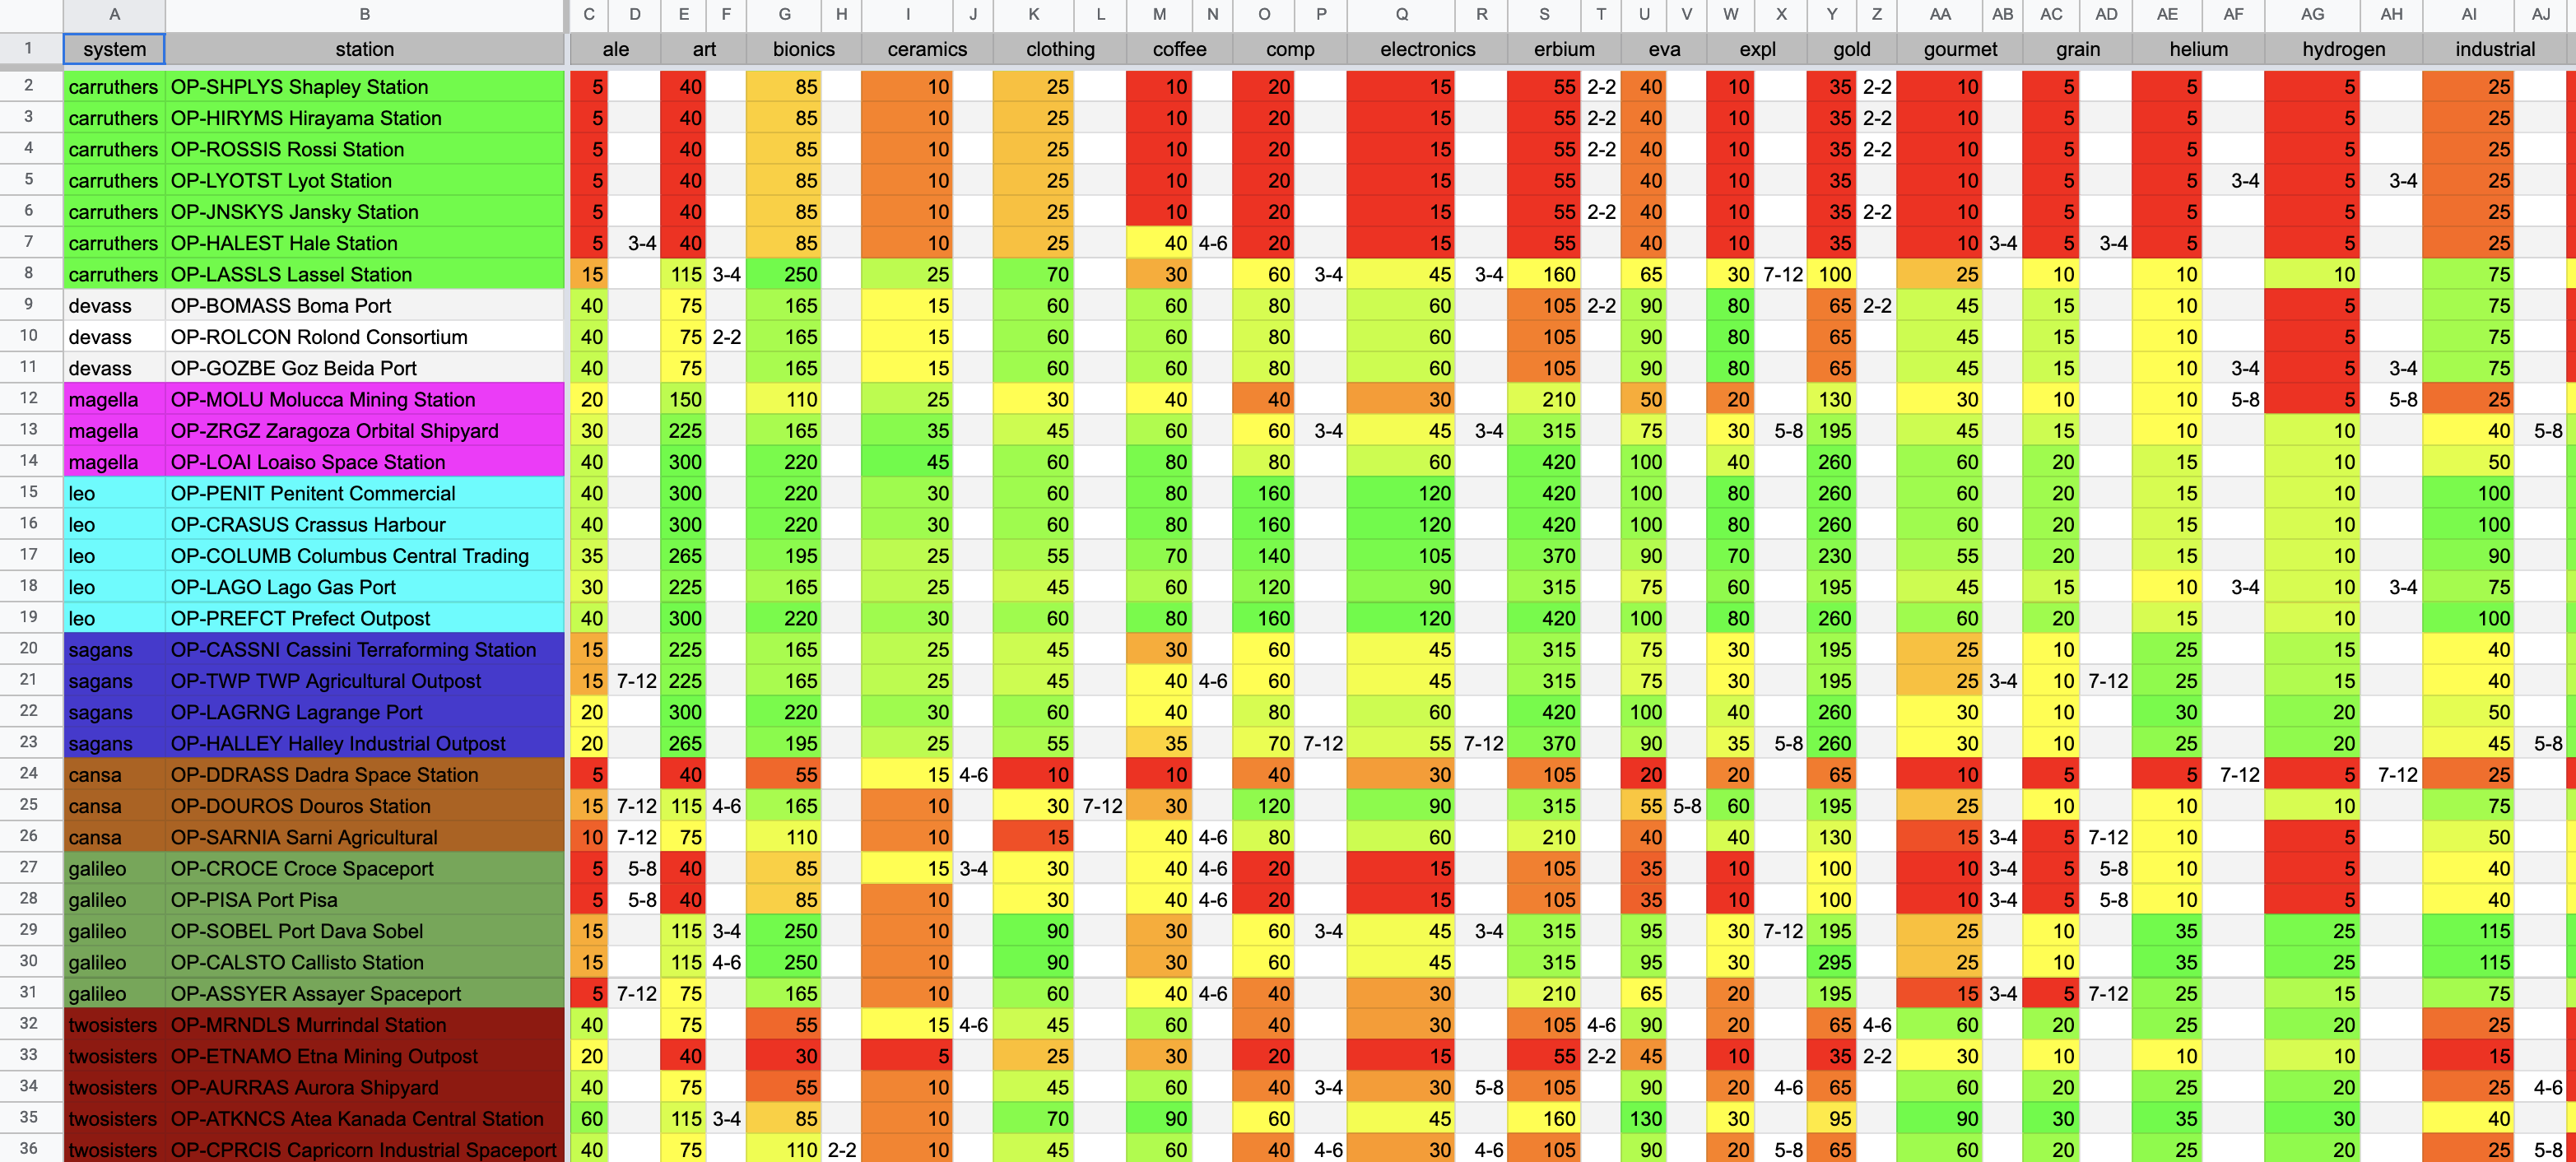
For every station, Das Kalkulationstabelle describes what its predicted price for every commodity is, and how much of each commodity that station sells. If there’s no number next to a commodity’s price, it means that station doesn’t sell that commodity. Zum Beispiel, if you want to buy gold, look for stations that both have some in stock Und price it low. When selling gold, look for stations that price it high.
The Files
OK, also das ist Was we know about the stations. Aber Wie do we know it, and what do we still have to learn? If this interests you, weiterlesen, and please comment if you have any ideas about what the data in the files could mean!
Note that this topic was discussed a few years ago in this Faden. Many thanks to davecortesi and Dr_Bicinium, who figured out how commodity counts are encoded, along with part of how prices are calculated. davecortesi wrote a Python program to turn the data into a usable form, but I couldn’t find it so I wrote my own Python program zu tun. It also extracted a bunch of data about one-off, contract-specific commodities, which I manually removed from the spreadsheet since they’re not really part of the dynamic economy.
Here’s what we have so far:
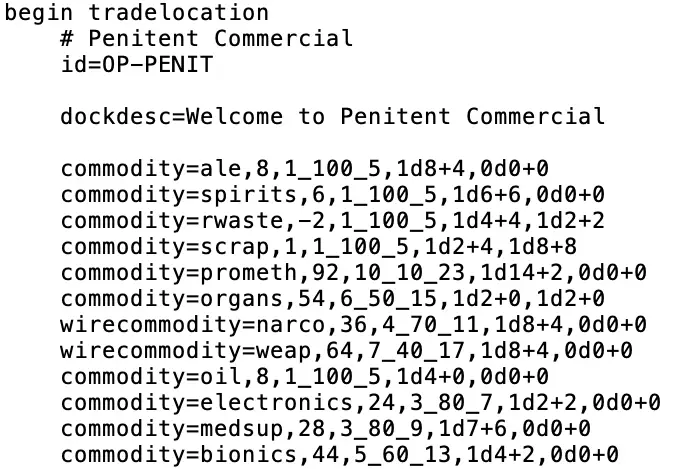
The game stores the trading data for every station, grouped by star system, in files with names like „trading_leo.txt“ in the same directory as most of the other game data. The data for each tradable item at each station is formatted like this:
„commodity=oxygen,2,1_100_5,1d3+3,1d2+2“
- The first part tells which commodity is being described. Illegal items are instead labeled „wirecommodity“, but the rest of the line’s parts are the same format as with legal items.
- The second part multiplied by 5 gives the item’s predicted price, which can be viewed when talking with a station in the comms panel. I think this acts as the item’s default price, which is then added to or subtracted from by a random amount to get the actual price. The random amount is recalculated each time you reload a save or revisit a station. Sometimes the base number the price varies around is different, like when you sell so much of an item that the station lowers its price. I’m not sure whether the base number is determined by the station data, the actions of non-player merchant ships, or some other market force.
- I don’t know what the third part means. Dr_Bicinium had the idea that the middle number might be some sort of multiplier or percentage since it tends to be 100.
- No idea what the fourth part does, but like the fifth part it probably refers to a dice roll.
- The fifth part is how many of the item the station has for sale. It’s a dice roll, described in a format used by some dice-based games such as Dungeons & Drachen. Zum Beispiel, „3d6+5“ bedeutet „use a 6-sided die, roll it 3 mal, and add 5 to the sum of those rolls“, meaning the result can be any number from 8 Zu 23. „1d2+2“ means the result can be 3 oder 4. Most items at each station have „0d0+0“ for this value, meaning they sell 0 of that item (they don’t sell it).
If you have an item in your cargo that a station also happens to sell, the price it buys your item at is close to the price it sells the item for, but typically at least 5c lower. Selling a bunch of an item to a station will decrease that station’s demand for that item, decreasing that item’s price. Since the buying and selling prices are linked, this means the price you buy that item at will now be lower, potentially making it profitable to buy a bunch of that item again and sell it at a different station where the price is higher.
When selling a lot of a single item at a single station, the trading terminal shows you how you’ll get less and less money the more you sell (AKA diminishing returns), since by increasing the station’s supply you decrease its demand. I recorded this pattern in the „Single-station notes“ sheet. The prices decreased at a steady rate, um 90% of the previous price. Each price took the same number of items to bring it lower, except for the highest price which took a different number of items to bring down. Zum Beispiel, in one instance sand could be sold for 110c 4 mal, then 100c 5 mal, then 90c 5 mal, and so on until 70c when I only had 1 unit left to sell. I suspect the third part of the data line (the one formatted like „2_90_7“ as seen in Adari’s data on sand) refers to this because of the conspicuous 90, but more experimenting might clear this up.
Das ist alles, was wir heute dafür teilen Objects in Space Führung. Dieser Leitfaden wurde ursprünglich erstellt und geschrieben von fishfritters. Für den Fall, dass wir diesen Leitfaden nicht aktualisieren können, Sie können das neueste Update finden, indem Sie diesem folgen Verknüpfung.